Signage Methodology
information graphics
Employer : AREP designlab
Paris, France, January 2017
Recently, in July 2016, I got hired at Arep group as a wayfinding systems programmer. Arep is a 1 500 employees company that designs and builds France’s railways stations all around the country, as well as other major transport operators’ signage system, interior design also in France and abroad.
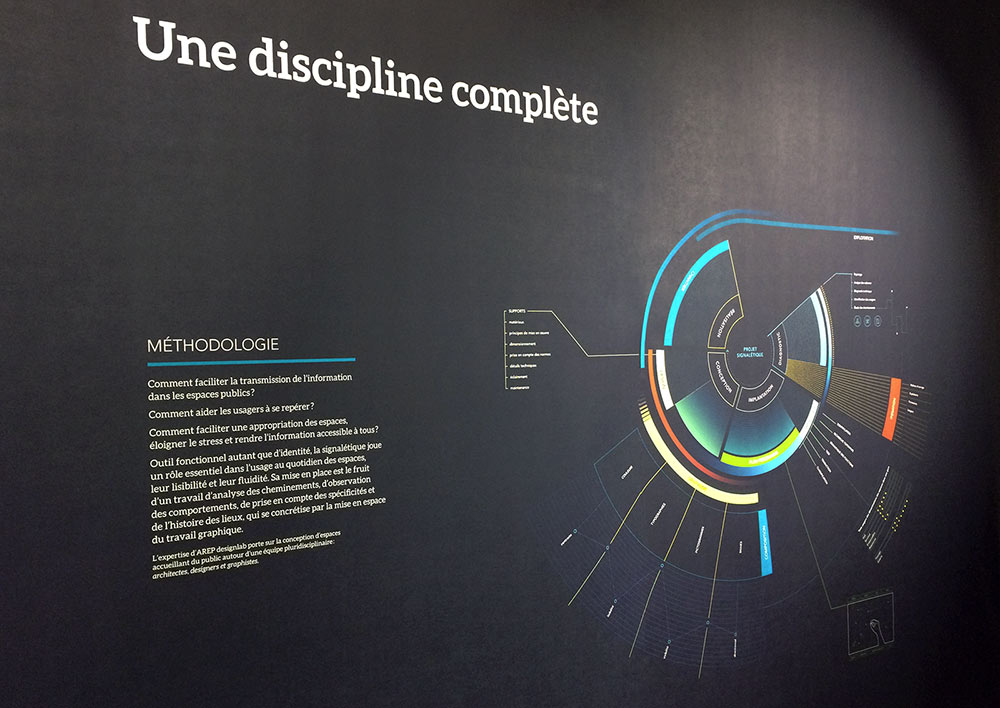
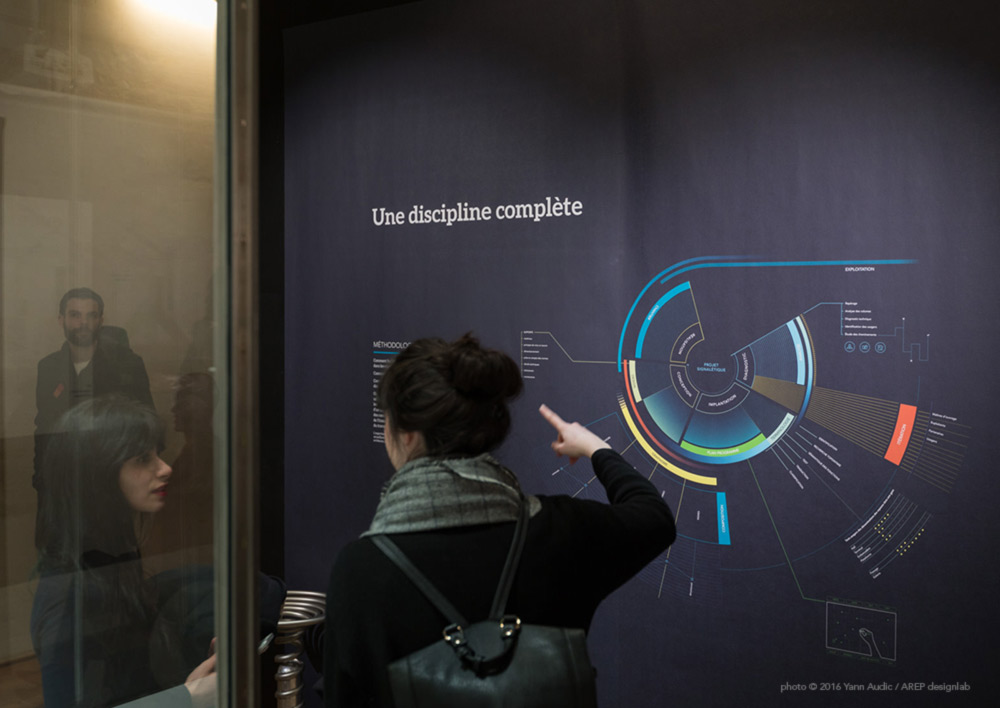
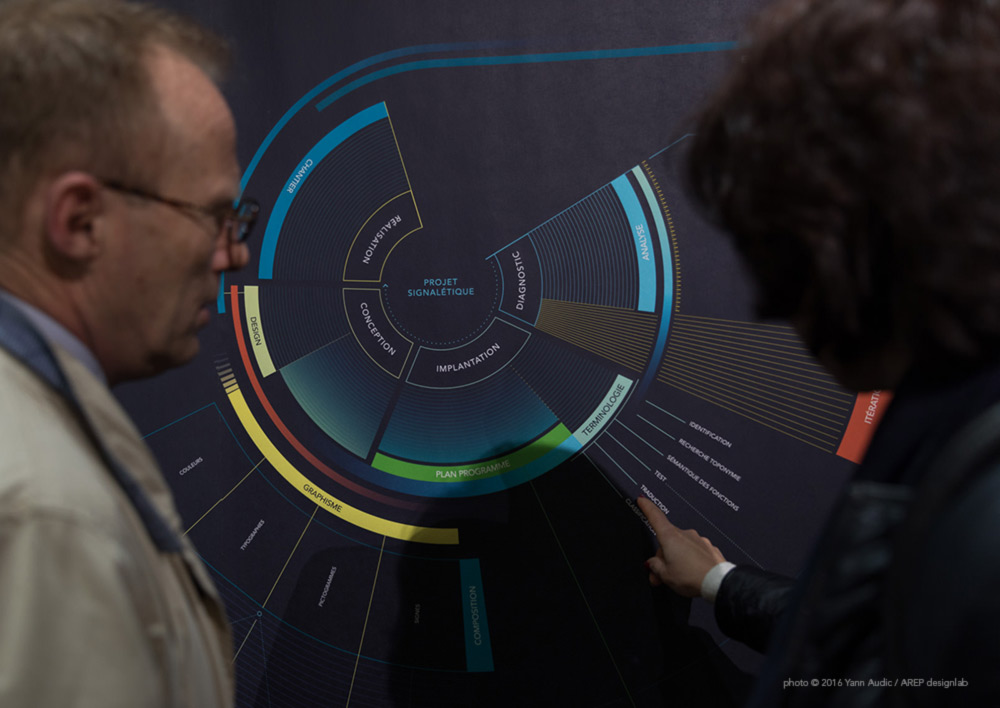
We (AREP designlab -Arep’s design department-) got invited to participate at the Parisian Graphic Design Festival, in which we were assigned an exhibition hall at Musée des Arts Décoratifs.
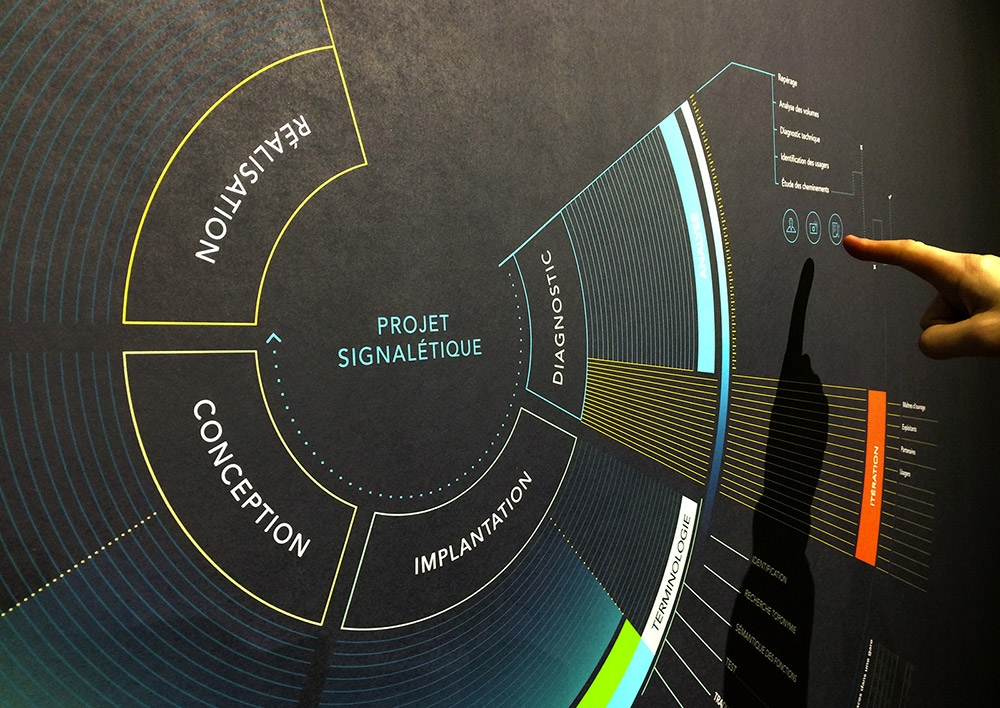
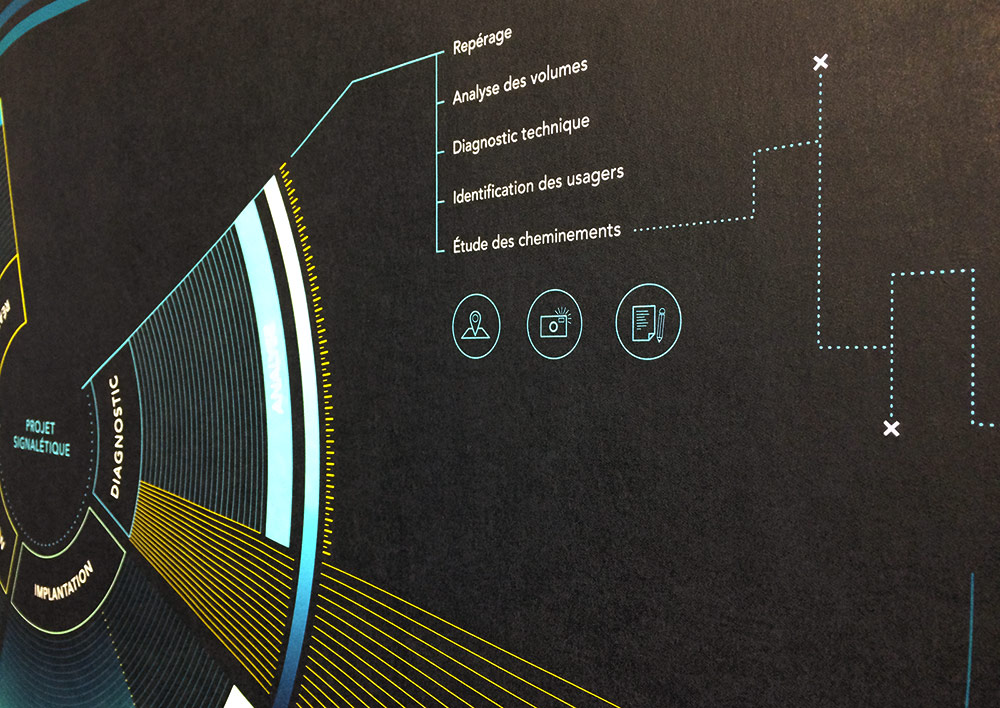
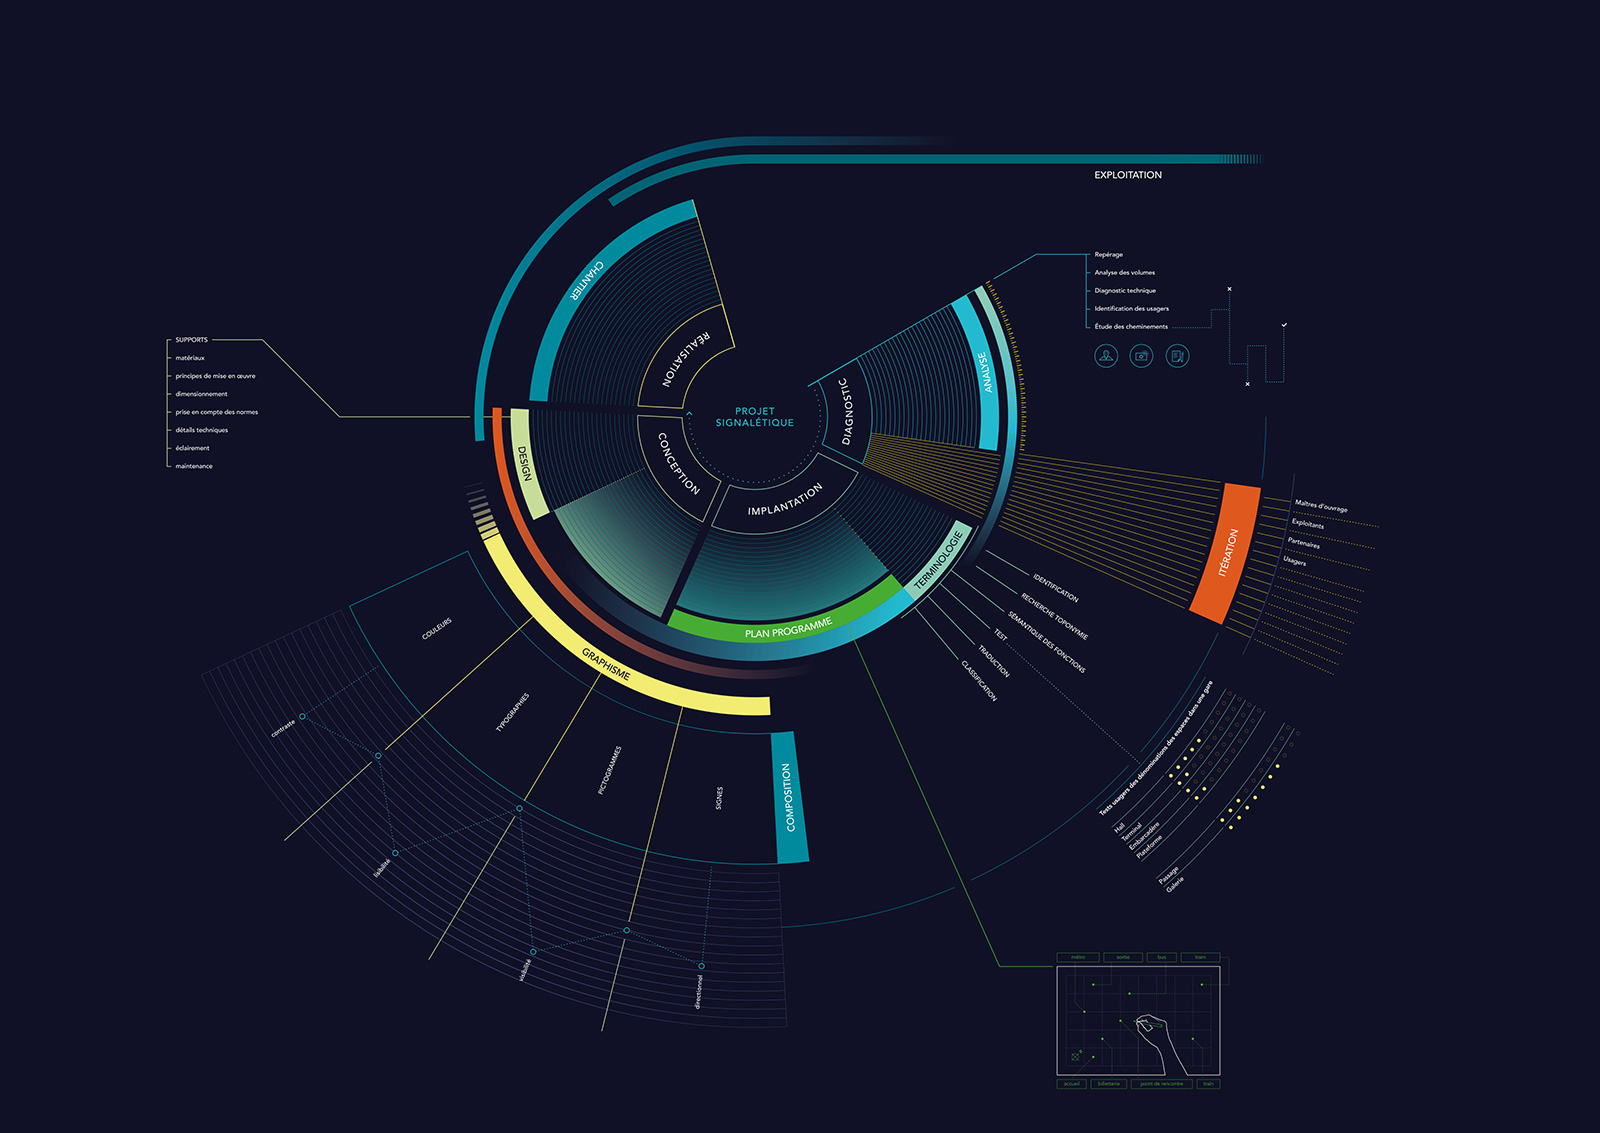
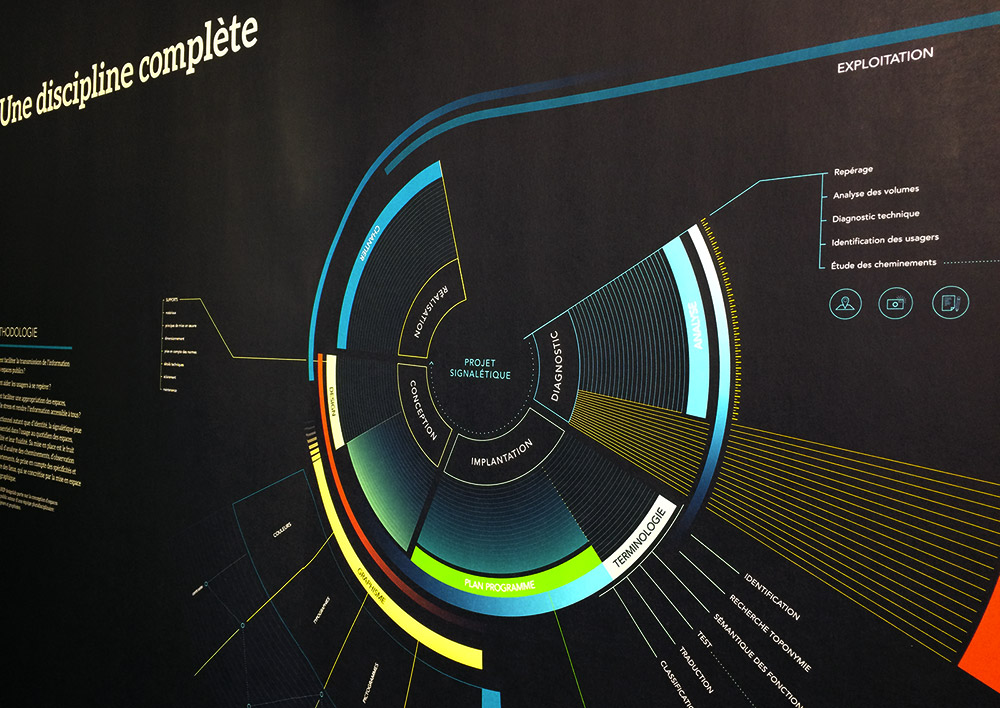
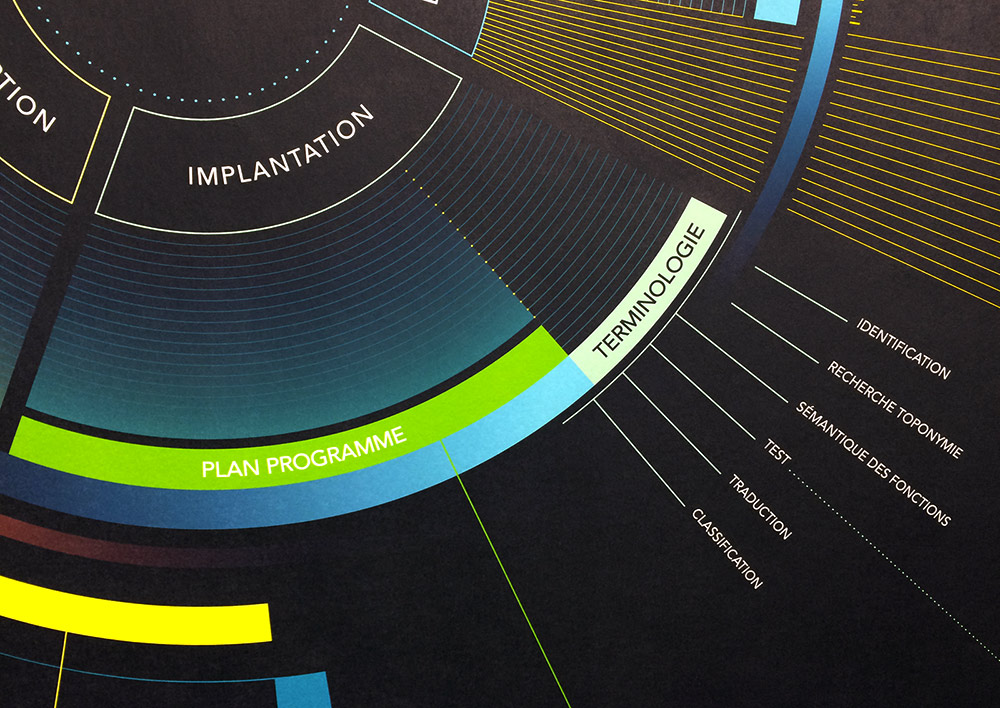
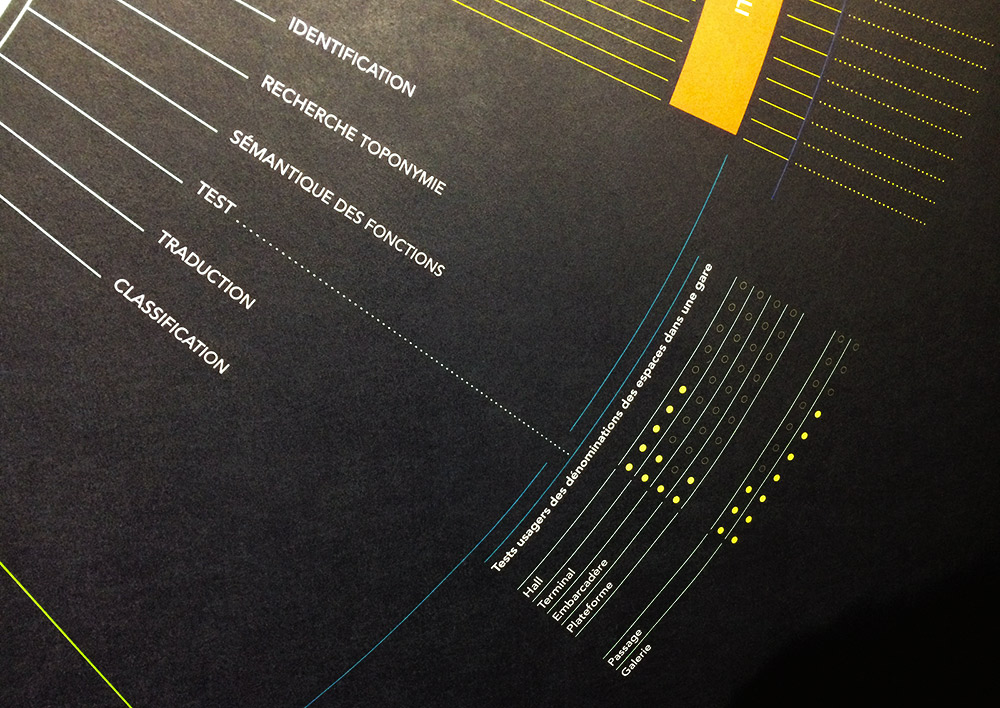
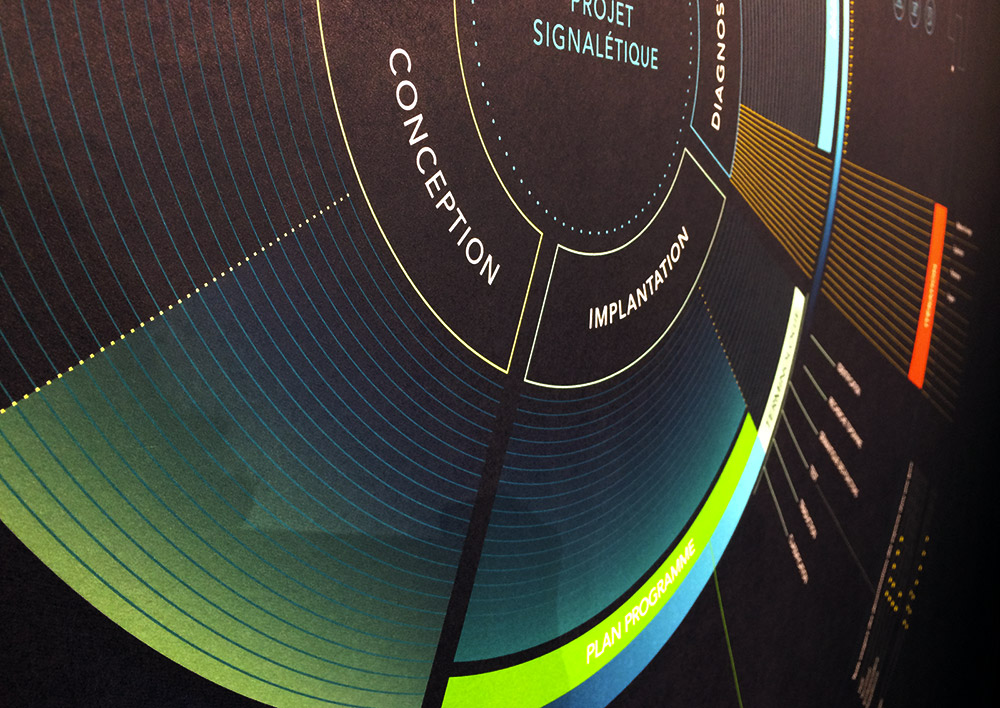
My work here was to create a data graphic that explains the process of conceiving functional wayfinding systems.
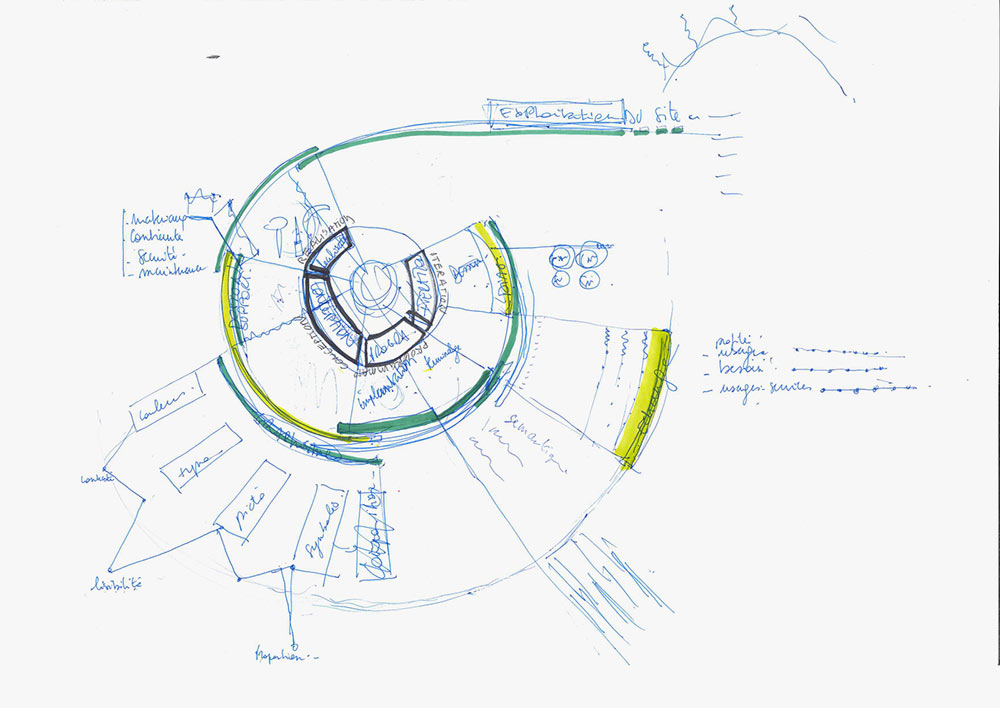
Since I’m pretty new in this field, this graphic was only possible with the help of my colleagues and project managers Marion Maurice and Adeline Bacquelaine, whose mastery on the subject led to define and hand draw the preliminary sketch and skeleton of this intergalactic pie chart (sketch image below). I then went on to polish its shape in vectors and colors.
AREP group : www.arep.fr
Some images © 2017 Yann Audic (http://www.yannaudic.com/) / AREP designlab